When Stagflation Strikes, Here’s What Gold Does
Posted on July 05, 2022
By Paul Vanguard, for BullionMax.com
This
analysis by Verdad, a data-driven global asset management firm, is
extremely interesting for several reasons. (Not the least of which is what transpired in the meantime.) I first read this in early May.
To shorten a fairly lengthy analytic take, here's the situation:
The Federal Reserve waited too long to raise interest rates, let inflation get too high before grudgingly responding.
Instead of raising interest rates and “cooling the economy“
while inflation and growth were rising, the Fed started hiking
too late – when growth was
already slowing down.
Fine, you could question whether there has been any
real economic growth over the past few years outside of stimulus-driven spending. But I don't want to get into that right now.
In early May, the U.S. stock market tumbled alongside bonds in what is an unusual sight. Here's what it looks like, charting the S&P500 and the
Vanguard Total Bond Market Index Fund (BND):
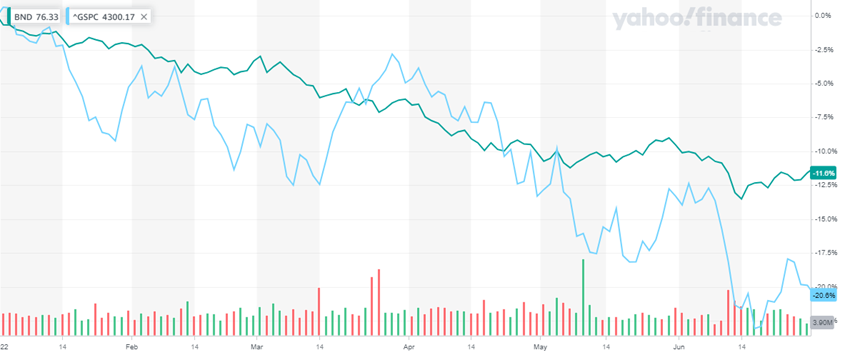
While those volatile
stocks returned -20.6% putting the market officially into bear territory, the diversifying power of bonds (the yin to stocks' yang, the vanilla to the S&P500's chocolate) rode to the rescue by...
handing you a -11.6% loss.
OUCH. What use is the standard-issue "conservative" 60/40 stock/bond portfolio when
both sides are plunging? I mean, it looks like the end of
Thelma & Louise to me!
Unusual but not unprecedented
The whole point of adding a slug of bonds to your stocks is because the two asset classes are not closely correlated. Here's another chart. I put a red line right in the middle where I want you to look.
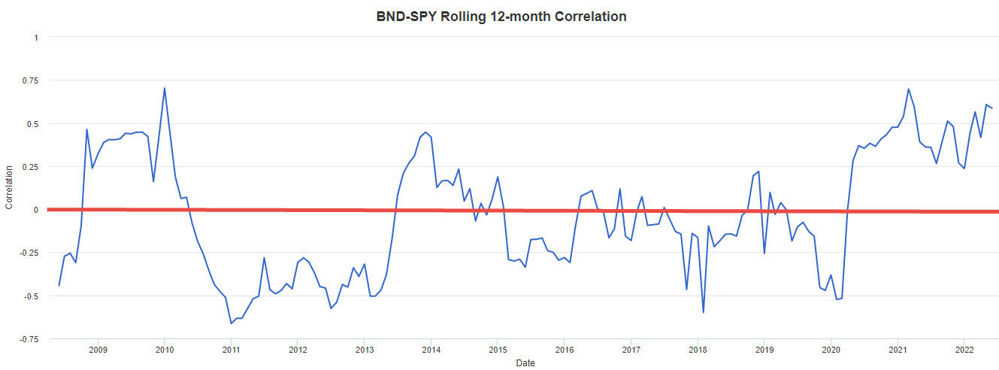
Durations
above the red line mean stocks and bonds (specifically, the S&P500 and BND) are
moving in the same direction.
Durations
below the red line? Prices are moving in
opposite directions.
At a glance, I think you'd agree there's a lot more time spent
below the red line than above it.
However, ever since the so-quick-it-almost-didn't-happen pandemic recession in 2020,
stocks and bonds have become inseparable. They go
everywhere together!
It's probably not much comfort to hear
WSJ's take:
It’s the Worst Bond Market Since 1842. That’s the Good News.
Well, those who've seen their brokerage account balances plummet so far this year will
surely feel comforted knowing their great-great-great grandparents no doubt felt just as bad...
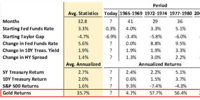
Okay, back to Verdad's analysis: The Fed's proposed actions hiking, 25-basis points in March and 50 in May won't be enough. The Fed will have to hike more. (Note – they were right!)
Verdad's reserachers found four other historical periods with the same set-up: high inflation, HUGE difference between the Effective Federal Funds Rate and where that rate
should be according to the
Taylor Rule, and – well, I'll let the chart talk for me:
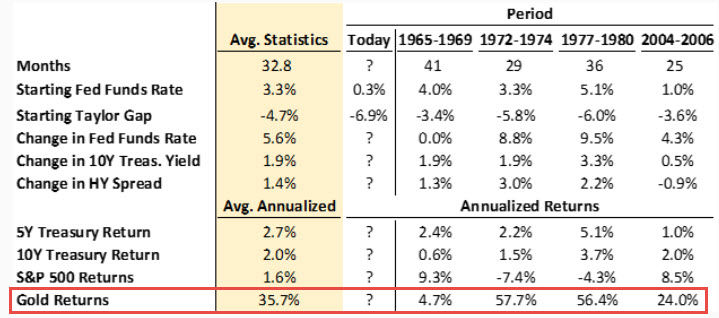
Historically speaking, based on Verdad's research, gold price surges nearly 36% on average during times like these.
That's why we're calling the recent 6-month low in gold's price a
sale brought to you by the Federal Reserve. If you
buy gold today, and if history repeats itself, you'll be
very happy you took advantage of these “discount prices“ while they last.
Paul Vanguard is a lifelong precious metals enthusiast and a proud member of the BullionMax team.